Who gets heard? How close are the people at the top? An exploration of a 2015 Zhihu sample, through four questions.谁被看见?大V之间有多近?从四个问题,探索 2015 年知乎的一份样本。
≈26,000user profiles名用户≈4.61Moutgoing follow links条向外关注连接One seed · two following steps · a historical snapshot单一种子 · 沿关注关系两层扩展 · 历史快照
01 / 04
Look inside the network.走进关注网络。
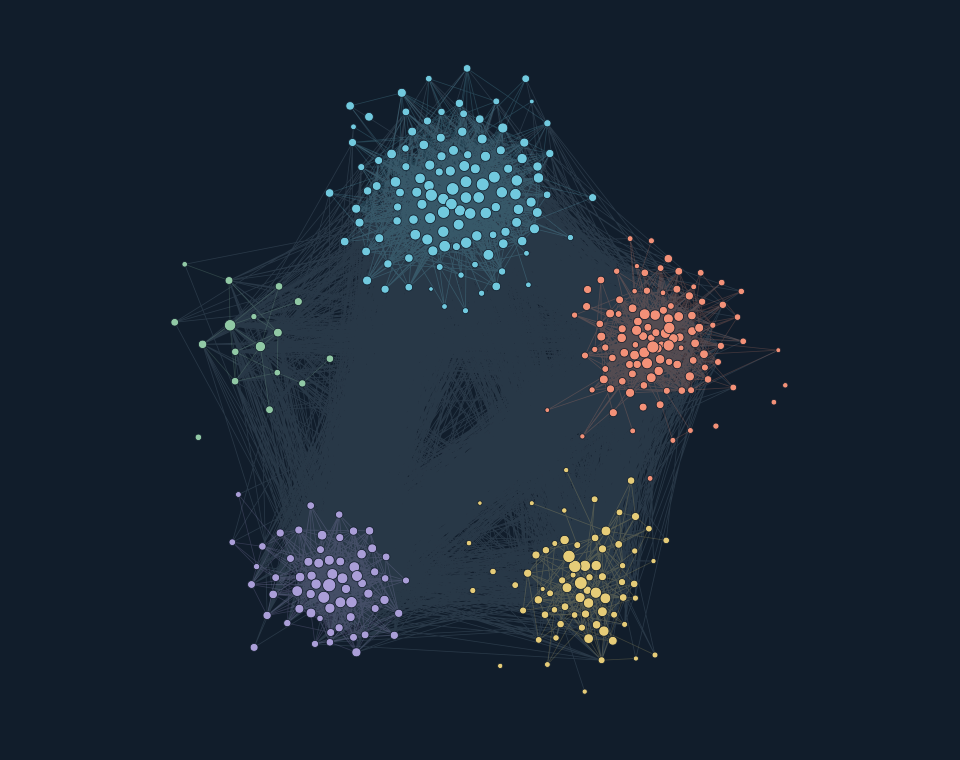
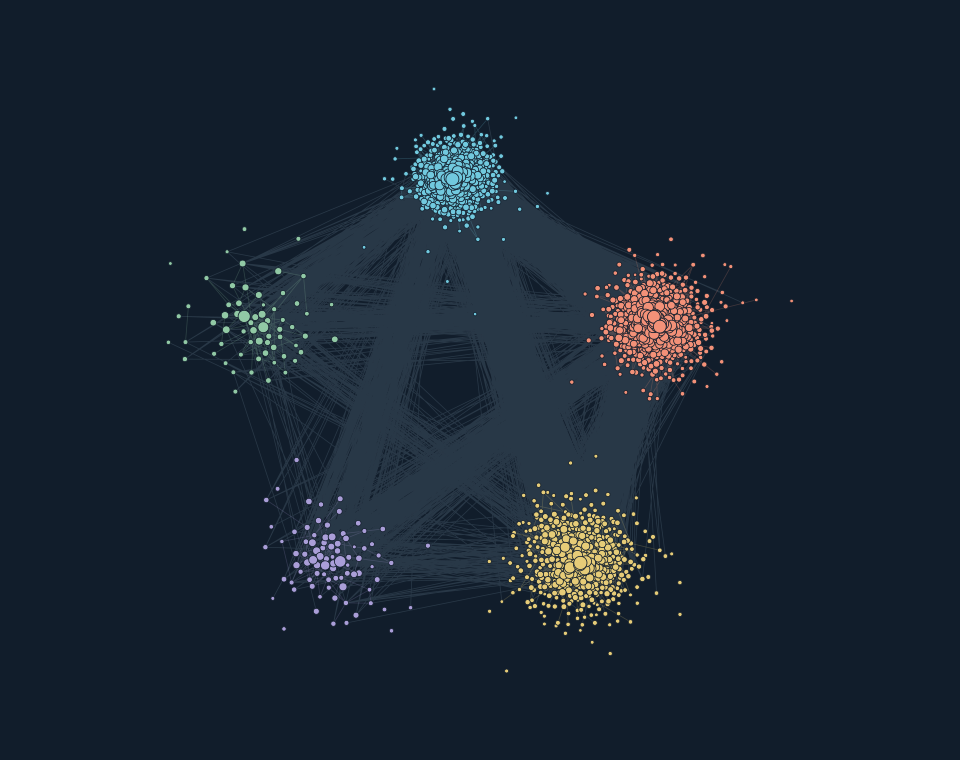
Start with the connections. Switch scales, inspect a user’s neighbours, or zoom out to the relationships between structural groups.先看连接本身。切换网络规模,走进一个节点的邻居,或者退一步看不同分组怎样相连。
Net50k · 375 users名用户 · 27,324 directed links条有向连接Tap a node. Follow the connections.点一个节点,沿连接看进去。
Real 2015 following links, rebuilt from the verified archive. Node size shows incoming follows within this network. Colours identify computed structural groups, not professions or topics. Layout distance is not social distance. Only names already published in the original articles are labelled; other accounts stay anonymous. User numbers are ordered by incoming follows within each network.由核验过的 2015 年归档重建。点越大,在这张网络内被关注越多。颜色区分算法计算的结构分组,不代表职业或话题;图上的距离不等于社交距离。仅标出原文已发表的姓名,其余账号匿名;编号按网内被关注数排序。
Net10k recount contains 1,896 nodes, one more than the 1,895 in the published table; both have 231,416 links. Historical statistics below keep the original numbers. Background ink is sampled when needed; selecting a node always shows all its neighbours.Net10k 从归档复计为 1,896 个节点,比原文的 1,895 多 1 个;连接数同为 231,416。下方历史统计保留原文数字。概览背景按需抽取连线;选中节点后,会显示它的全部邻居。
Directed links between all groups各分组之间的有向连接数
Original network statistics原文的网络统计
Net10k Upvotes > 10,000赞同 > 1 万
6.4%of possible directed links exist可能的有向连接中,实际存在的比例
Users用户
1,895
Following links关注连接
231,416
In the largest SCC最大强连通分量内
1,853 / 1,895
Mean shortest path¹平均最短路径¹
2.11
Longest shortest path¹最长的最短路径¹
5
Net50k Upvotes > 50,000赞同 > 5 万
19.5%of possible directed links exist可能的有向连接中,实际存在的比例
Users用户
375
Following links关注连接
27,324
In the largest SCC最大强连通分量内
368 / 375
Mean shortest path¹平均最短路径¹
1.85
Longest shortest path¹最长的最短路径¹
4
¹ Path lengths are calculated only within each network’s largest strongly connected component. Density is reported at the original precision.¹ 路径长度仅在各网络的最大强连通分量内计算。密度沿用原文精度。
How directed paths work如何理解有向路径
What does “three steps away” mean?“三步之遥”是什么意思?
Illustration · not sampled users示意图 · 非真实用户
A → B → C → D: 3 following links.A → B → C → D:经过 3 条关注连接。
What can this comparison tell us?这组比较能说明什么?
These are overlapping groups selected by upvotes, with different sizes. Their density difference describes this sample; it does not by itself prove a preference for forming elite circles. A strongly connected component means that directed paths exist both ways between every pair of its users.这两个群体按赞同数筛选,彼此重叠、规模也不同。密度差异描述了这个样本,不能单凭它证明大V偏好抱团。强连通分量意味着其中任意两人之间,都有沿关注方向彼此到达的路径。
A few very large counts pull the mean away from the middle. Select a metric to see the gap.少数极大的数值,把均值拉离了中间位置。选一个指标,看看这个差距。
Upvotes赞同
Per user · 2015 sample每名用户 · 2015 年样本
Mean均值
3,858.4
Median中位数
96
40.2×The mean is this many times the median.均值是中位数的这么多倍。
Where are the users?这些用户分布在哪里?
26,161 records · grouped by magnitude26,161 条记录 · 按数量区间分组
Upvotes per user每人的赞同数Users · share of sample用户数 · 样本占比
0
4,74518.1%
1–9
3,08211.8%
10–99
5,34520.4%
100–999
6,29624.1%
1,000–9,999
4,79718.3%
10,000–99,999
1,7356.6%
100,000–999,999
1600.6%
≥1,000,000
10.0%
Recounted from the recovered 2015 archive on 1 Oct 2026. Bar length shows users per interval, on a linear scale. Intervals have different widths; this is not a probability-density plot.2026-10-01 从恢复的 2015 年归档重新计数。柱长线性表示各区间的用户数;区间宽度不同,这不是概率密度图。
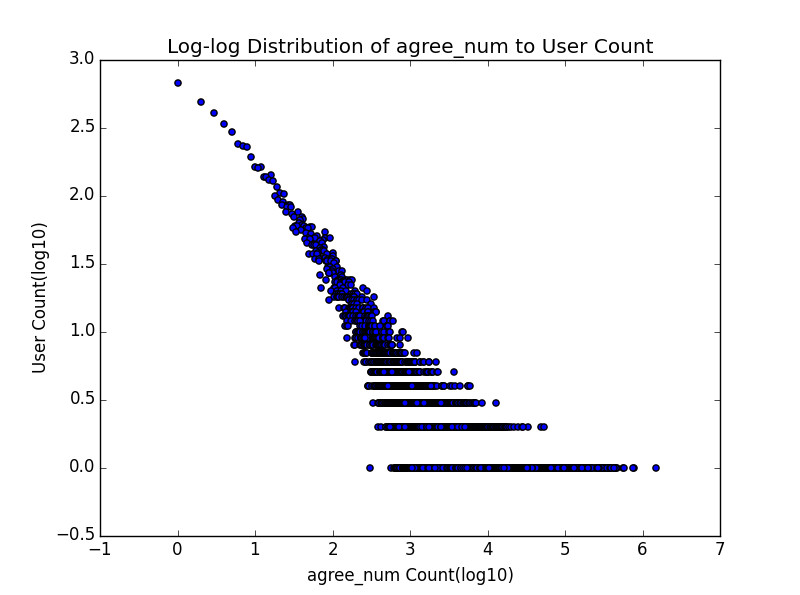
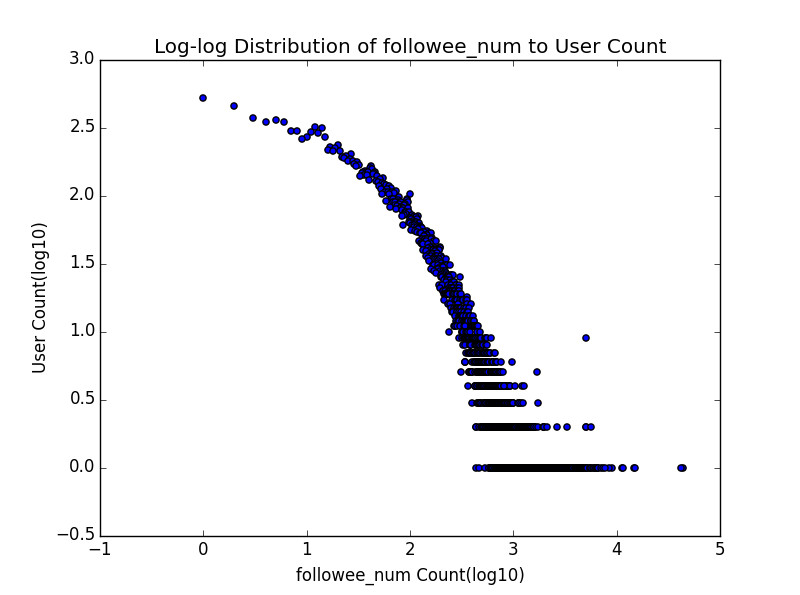
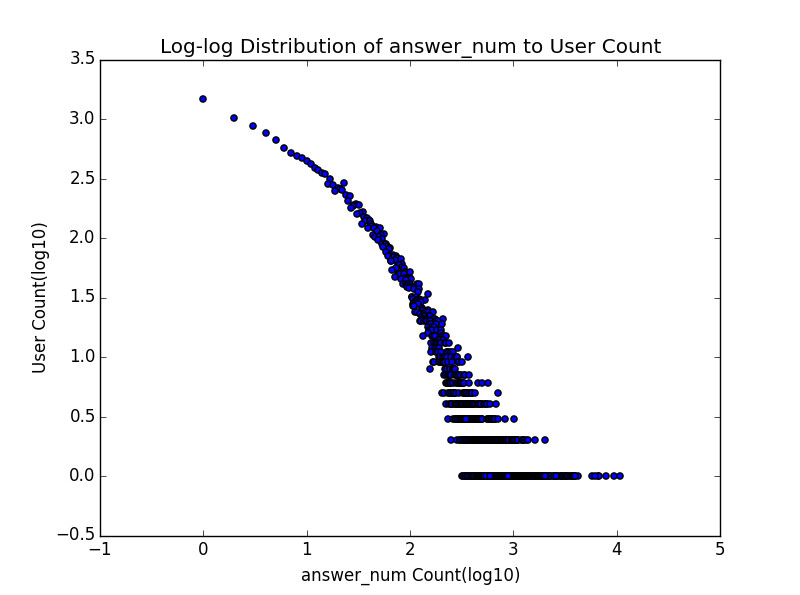
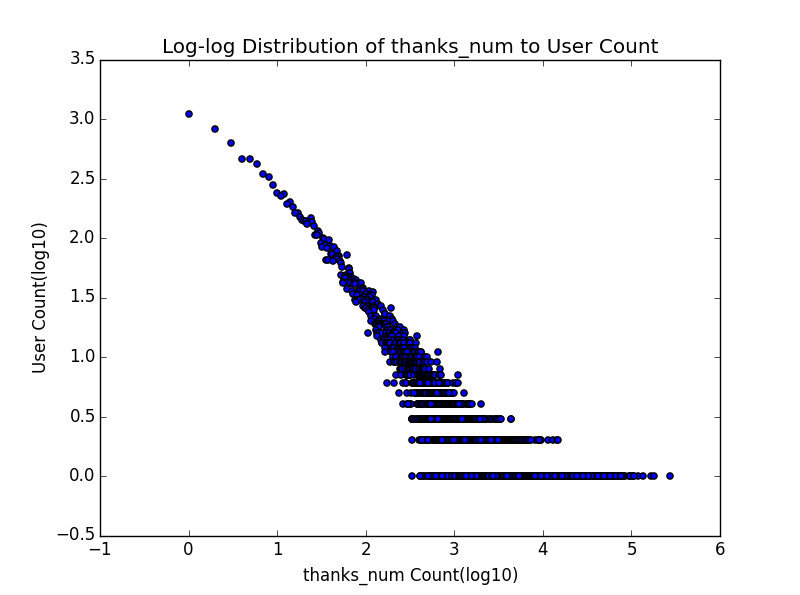
See the original distribution查看当年的分布图Original published figure. Axes use log₁₀; points show the frequency of each count.原文图表。横纵轴取 log₁₀;散点表示每个计数值对应的用户频数。
Followers粉丝
Per user · 2015 sample每名用户 · 2015 年样本
Mean均值
3,620.0
Median中位数
112
32.3×The mean is this many times the median.均值是中位数的这么多倍。
Where are the users?这些用户分布在哪里?
26,161 records · grouped by magnitude26,161 条记录 · 按数量区间分组
Followers per user每人的粉丝数Users · share of sample用户数 · 样本占比
0
00.0%
1–9
2,0207.7%
10–99
10,53540.3%
100–999
8,26731.6%
1,000–9,999
3,86514.8%
10,000–99,999
1,2995.0%
100,000–999,999
1750.7%
≥1,000,000
00.0%
Recounted from the recovered 2015 archive on 1 Oct 2026. Bar length shows users per interval, on a linear scale. Intervals have different widths; this is not a probability-density plot.2026-10-01 从恢复的 2015 年归档重新计数。柱长线性表示各区间的用户数;区间宽度不同,这不是概率密度图。
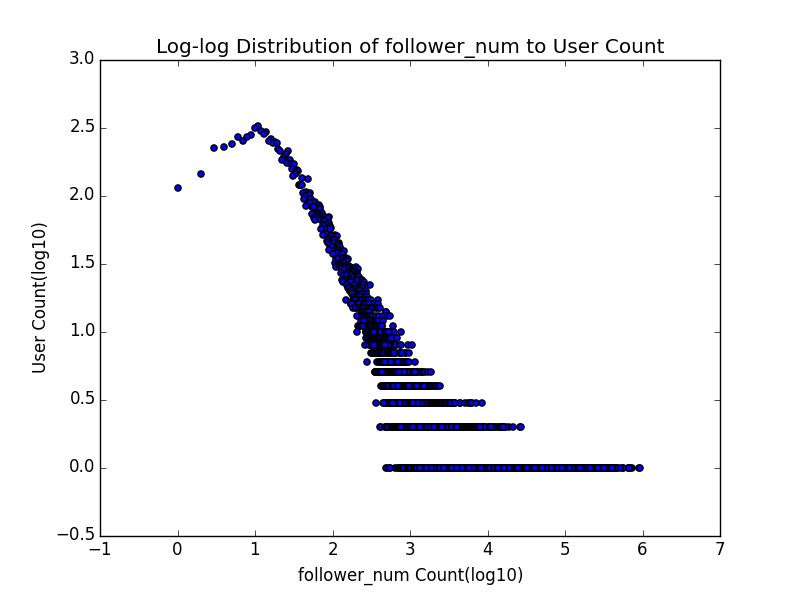
See the original distribution查看当年的分布图Original published figure. Axes use log₁₀; points show the frequency of each count.原文图表。横纵轴取 log₁₀;散点表示每个计数值对应的用户频数。
Following关注
Per user · 2015 sample每名用户 · 2015 年样本
Mean均值
176.3
Median中位数
67
2.6×The mean is this many times the median.均值是中位数的这么多倍。
Where are the users?这些用户分布在哪里?
26,161 records · grouped by magnitude26,161 条记录 · 按数量区间分组
Following per user每人的关注数Users · share of sample用户数 · 样本占比
0
3801.5%
1–9
3,26012.5%
10–99
12,24846.8%
100–999
9,67337.0%
1,000–9,999
5942.3%
10,000–99,999
60.0%
100,000–999,999
00.0%
≥1,000,000
00.0%
Recounted from the recovered 2015 archive on 1 Oct 2026. Bar length shows users per interval, on a linear scale. Intervals have different widths; this is not a probability-density plot.2026-10-01 从恢复的 2015 年归档重新计数。柱长线性表示各区间的用户数;区间宽度不同,这不是概率密度图。
See the original distribution查看当年的分布图Original published figure. Axes use log₁₀; points show the frequency of each count.原文图表。横纵轴取 log₁₀;散点表示每个计数值对应的用户频数。
Answers回答
Per user · 2015 sample每名用户 · 2015 年样本
Mean均值
68.9
Median中位数
17
4.1×The mean is this many times the median.均值是中位数的这么多倍。
Where are the users?这些用户分布在哪里?
26,161 records · grouped by magnitude26,161 条记录 · 按数量区间分组
Answers per user每人的回答数Users · share of sample用户数 · 样本占比
0
3,54713.6%
1–9
6,84926.2%
10–99
11,72744.8%
100–999
3,83314.7%
1,000–9,999
2040.8%
10,000–99,999
10.0%
100,000–999,999
00.0%
≥1,000,000
00.0%
Recounted from the recovered 2015 archive on 1 Oct 2026. Bar length shows users per interval, on a linear scale. Intervals have different widths; this is not a probability-density plot.2026-10-01 从恢复的 2015 年归档重新计数。柱长线性表示各区间的用户数;区间宽度不同,这不是概率密度图。
See the original distribution查看当年的分布图Original published figure. Axes use log₁₀; points show the frequency of each count.原文图表。横纵轴取 log₁₀;散点表示每个计数值对应的用户频数。
Thanks感谢
Per user · 2015 sample每名用户 · 2015 年样本
Mean均值
865.3
Median中位数
28
30.9×The mean is this many times the median.均值是中位数的这么多倍。
Where are the users?这些用户分布在哪里?
26,161 records · grouped by magnitude26,161 条记录 · 按数量区间分组
Thanks per user每人的感谢数Users · share of sample用户数 · 样本占比
0
5,20019.9%
1–9
4,84318.5%
10–99
6,84326.2%
100–999
6,00222.9%
1,000–9,999
2,81510.8%
10,000–99,999
4501.7%
100,000–999,999
80.0%
≥1,000,000
00.0%
Recounted from the recovered 2015 archive on 1 Oct 2026. Bar length shows users per interval, on a linear scale. Intervals have different widths; this is not a probability-density plot.2026-10-01 从恢复的 2015 年归档重新计数。柱长线性表示各区间的用户数;区间宽度不同,这不是概率密度图。
See the original distribution查看当年的分布图Original published figure. Axes use log₁₀; points show the frequency of each count.原文图表。横纵轴取 log₁₀;散点表示每个计数值对应的用户频数。
Bars share a zero baseline within each metric. A long tail alone does not establish a power-law distribution.同一指标的两条柱从零起算。长尾现象本身不足以证明幂律分布。
The answer changes with the question. Compare the published leaders under three network measures.衡量方式改变,答案也会改变。对照三种网络指标下,原文发表的前五名。
Net10k · Published Top 5原文前五名
PageRank
Attention passed through the network沿关注网络传递的关注权重
1黄继新0.00736
2马伯庸0.00560
3张佳玮0.00551
4葛巾0.00510
5周源0.00503
Authority权威度
Followed by high-scoring hubs受到高分枢纽关注的节点
1张佳玮0.0345
2梁边妖0.0339
3葛巾0.0324
4马伯庸0.0319
5黄继新0.0315
Hub枢纽度
Following high-scoring authorities关注高分权威节点的节点
1周诺0.00344
2杨大懒人0.00338
3君陌Faust0.00336
4ZENHO0.00325
5干脆面0.00290
Net50k · Published Top 5原文前五名
PageRank
Attention passed through the network沿关注网络传递的关注权重
1黄继新0.0112
2马伯庸0.0103
3张佳玮0.0102
4梁边妖0.0095
5cOMMANDO0.0090
Authority权威度
Followed by high-scoring hubs受到高分枢纽关注的节点
1梁边妖0.00749
2张佳玮0.00721
3马伯庸0.00683
4采铜0.00677
5谢熊猫君0.00670
Hub枢纽度
Following high-scoring authorities关注高分权威节点的节点
1杨大懒人0.00976
2君陌Faust0.00972
3ZENHO0.00953
4Edison Chen0.00885
5徐湘楠0.00798
Scores belong to different algorithms and networks: compare positions, not score magnitudes across lists. An absent name means “not in the published Top 5”, not a zero score. Names are as published in 2016.不同算法、不同网络的分数不在同一尺度上,应对照名次。名字未出现表示“未列入原文前五”,不代表分数为零。姓名沿用 2016 年原文。
What does influence mean here?这里的影响力指什么?
These are measures of position in a following network. They are not direct measures of expertise or answer quality. PageRank and HITS answer related but distinct questions; PageRank is not the product of the two HITS scores.这里衡量的是用户在关注网络中的位置,并不直接衡量专业水平或回答质量。PageRank 与 HITS 回答的是相关但不同的问题;PageRank 并不是两种 HITS 分数的乘积。
Two lists, one shared scale. Explore the overlap and the differences in the questions these selected users answered.两份列表,共用一个刻度。看看这些选定用户所答问题的话题,有哪些交集与不同。
Life, history, film — and different emphases生活、历史、电影,以及不同的侧重
Counts of question tags in answers by a selected dominating set. The two samples have different sizes. Unreported is not zero.统计各网络支配集用户所答问题的话题标签次数。两组样本规模不同。“未列出”不等于零。
Topic frequencies · all published entries话题频次 · 全部已发表条目
Topic话题
Net10k
Net50k
Survey questions调查类问题
3,792
1,365
Life生活
3,096
1,435
History历史
1,713
1,204
Dating恋爱
1,464
717
Psychology心理学
1,432
634
Film电影
1,419
1,084
Social relationships人际交往
1,404
640
Society社会
1,332
984
Internet互联网
1,214
595
Emotions情感
1,197
Unreported未列出
Politics政治
1,028
1,285
Gender relations两性关系
994
688
Education教育
897
Unreported未列出
China中国
823
695
Life choices人生
815
Unreported未列出
Games游戏
805
Unreported未列出
Literature文学
772
Unreported未列出
Zhihu知乎
772
Unreported未列出
Law法律
750
587
Music音乐
738
Unreported未列出
Love爱情
699
Unreported未列出
Culture文化
659
Unreported未列出
Entrepreneurship创业
628
Unreported未列出
University大学
621
Unreported未列出
Programmers程序员
619
Unreported未列出
Mental life心理
617
Unreported未列出
How would you rate X?你如何评价 X
609
Unreported未列出
Women女性
604
Unreported未列出
Programming编程
585
511
What is X like?X 是种怎样的体验
582
Unreported未列出
Health健康
Unreported未列出
996
Medicine医学
Unreported未列出
941
English英语
Unreported未列出
678
Microsoft微软(Microsoft)
Unreported未列出
555
United States美国
Unreported未列出
552
Fitness健身
Unreported未列出
538
The article labels both lists “Top 20”, but prints 30 entries for Net10k and 20 for Net50k. All are retained here. These are raw tag counts, not percentages of users or a platform-wide topic survey.原文两组标题都写“Top 20”,但实际列出 Net10k 30 项、Net50k 20 项,这里全部保留。这些是标签次数,并非用户占比或全站话题调查。
READING THIS STUDY TODAY今天回看这项研究
A sample, with a point of view.一份有视角的样本。
Where it begins样本从哪里来
The crawl began with Zhao Che’s account and followed outgoing links for two steps. The seed and both layers total three levels. This was not a random sample of Zhihu, and external follow targets are not all complete user profiles.爬取从 Zhao Che 的账号出发,沿关注关系扩展两层,连同种子共三层。这不是知乎的随机样本;向外关注连接的终点,也并非都有完整用户资料。
What is presented here这里呈现的是什么
The tables and rankings reproduce the original published results. Profile distributions were recounted from the recovered archive in 2026, and all five means and medians were checked against the original. Anonymous network views preserve the real archived following links; their grouping and layout were prepared in 2026. Later exploratory experiments are not presented as confirmed findings.统计表和榜单沿用原研究已发表的结果。用户分布于 2026 年从恢复的归档重新计数,五项均值、中位数也与原文核对一致。匿名网络图保留归档中的真实关注连接,分组与布局于 2026 年重新计算。后来的探索性实验没有被当作已确认结论。
What remains a question哪些仍然是问题
Long tails need distribution tests; denser groups need comparison baselines; low betweenness alone does not establish resilience to removing users. The sample does not describe today’s Zhihu.长尾需要分布检验;密集群体需要比较基线;低介性本身不能证明删除用户后的网络韧性。这份样本也不能描述今天的知乎。
The study behind the page研究与原文
A 2015 Social Computing course project at CUHK by Gu Zhijing, Huang Xianghai, Lyu Zishen and Zhao Che. Zhao Che worked on the database, basic statistics, network analysis, proposal, presentation and report.2015 年香港中文大学 Social Computing 课程小组项目,由 Gu Zhijing、Huang Xianghai、Lyu Zishen 和 Zhao Che 共同完成。Zhao Che 参与数据库、基本统计、网络分析、提案、演示及报告。